Presentation
The VizieR photometry tool allows for easy visualization of photometry points extracted around a given position or object name from photometry-enabled catalogues in VizieR.
Using the tool
- First, open the page https://vizier.cds.unistra.fr/vizier/sed/
- Then, enter an object name or a position (objects names are resolved by the Sesame service) and a radius.
The radius is currently limited to a maximum of 30 arcsec - After a few seconds, you should see the photometric points displayed as a function of wavelength.
The user interface is made of 3 different panels:
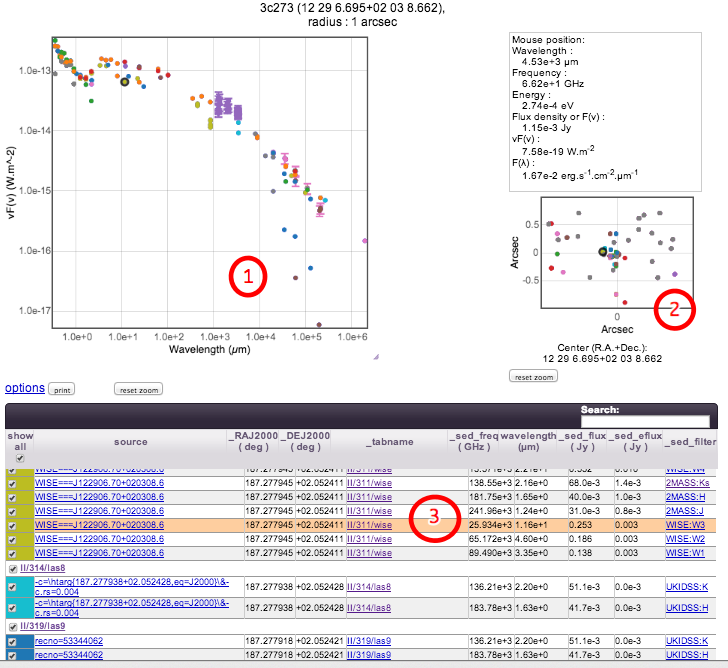
- The panel denoted ① displays the photometric points as a function of wavelength, frequency or energy.
Error bars are shown if the original catalogue included information on uncertainties.
Points are colour-coded according to the catalogues they have been extracted from (points coming from the same catalogue share the same colour).
You can zoom in simply by dragging a rectangle around the area of interest. Zoom out by double clicking on an empty region of the plot, or using the reset zoom button. - The panel ② shows a small sky map of the queried region, centered on the requested target.
Dragging a rectangle around an area will zoom in. Zoom out by double clicking or using the reset zoom button. - The tabular view in the panel ③ shows the actual frequency and flux values with links to the original catalogue and measurements.
These three panels are linked: clicking on a data point in the main plot or in the sky map will highlight the corresponding point
in the other plot and in the table. Conversely, clicking on a table row will highlight the corresponding point in the 2 other panels.
The photometric points can be exported (through SAMP) to VO tools like Topcat or Aladin using the dedicated button  .
.
They can also be retrieved directly as a VOTable using the following URL pattern:
Example: https://vizier.cds.unistra.fr/viz-bin/sed?-c=Vega&-c.rs=1.5 will return the VOTable with photometric points for a 1.5 arcsec region around Vega.
They can also be retrieved directly as a VOTable using the following URL pattern:
https://vizier.cds.unistra.fr/viz-bin/sed?-c=Target&-c.rs=Radius-in-arcsecExample: https://vizier.cds.unistra.fr/viz-bin/sed?-c=Vega&-c.rs=1.5 will return the VOTable with photometric points for a 1.5 arcsec region around Vega.
Feedback
Send your feedback, comments, suggestions or bug reports to this email address.
Authors
The VizieR photometry tool is developed by Anne-Camille Simon and Thomas Boch.
The VizieR service is developed by Gilles Landais and François Ochsenbein.